Maryland's Growth Industry Tool - Labor Market Information
The Growth Industry Tool, or GIT, allows you to view which industries are growing the most statewide or in your region of Maryland over the past year based on Quarterly Census of Employment & Wages data (QCEW). See how industries in your region rank according to:
- Overall employment;
- The number of establishments;
- The average weekly wage;
- The location quotient;
- The number of jobs added over the past year; and
- The percent growth in employment over the past year.
By default, information for Maryland is below. Find links to the GIT for 12 different regions at the bottom of the page.
About the Data
A location quotient measures how concentrated an industry is in a given area compared to the US. A location quotient of 1 indicates that employment is just as concentrated in your region as in the rest of the country. A location quotient of 2 indicates that there is twice as much employment in an industry in your region as we would expect given national employment patterns.
GIT groups industries into three categories: Growth, Emerging and Other.
- Growth Industries have a location quotient greater than one and positive over-the-year growth. These industries are specialized in your region and are expanding.
- Emerging Industries have a location quotient less than one and positive over-the-year growth. These industries are not yet specialized in your region, but they are expanding.
- Other Industries have negative over-the-year growth.
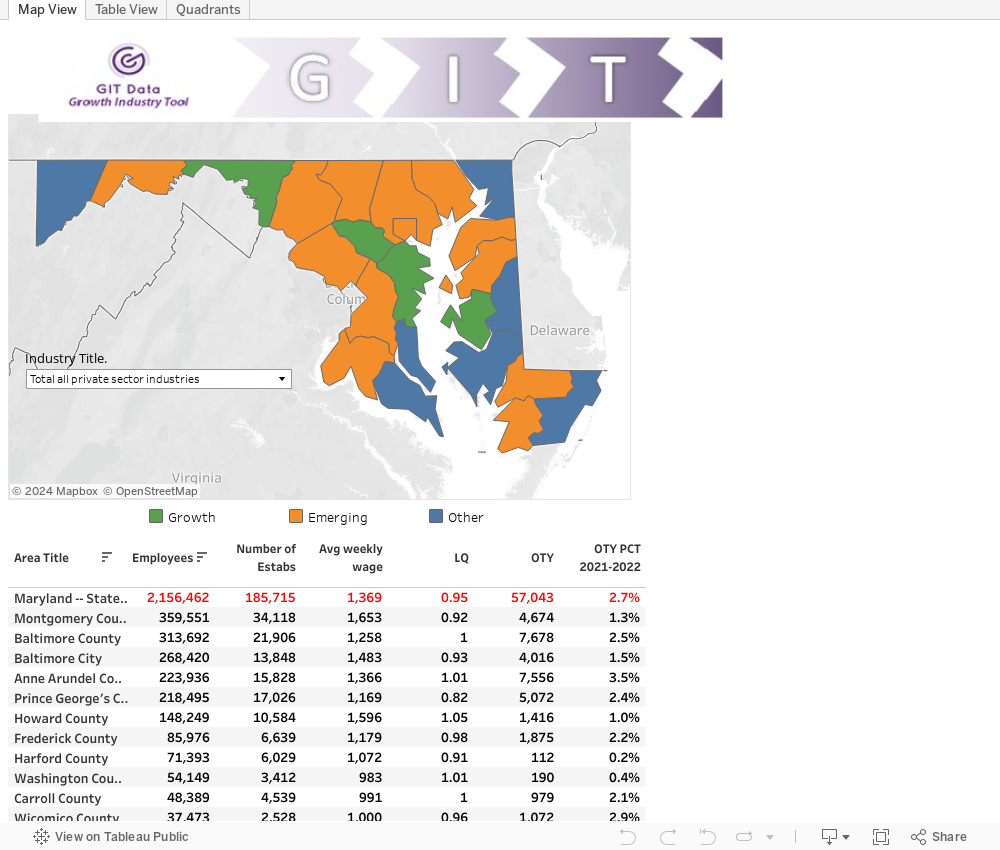
Key:
Number of Estabs. (Count of Businesses)
Avg Weekly Wage (Average Weekly Wages per employee)
LQ: Location Quotient (measures employment concentration)
OTY: Over the Year Change
OTY PCT: OTY Percentage Change
Growth industries: LQ > 1 and positive OTY
Emerging Industries: LQ < 1 and positive OTY
Other Industries: negative OTY
GIT Data for your local area:.
- Anne Arundel
- Baltimore City
- Baltimore
- Carroll
- Frederick
- Howard
- Lower Shore
- Montgomery
- Prince George's
- Southern Maryland
- Susquehanna
- Upper Shore
- Western Maryland
Maryland Department of Labor
Division of Workforce Development and Adult Learning
100 S. Charles Street, Tower 1
Baltimore, Maryland 21201
410-767-2250
[email protected]