Maryland's Growth Occupation Tool (GOT) - Labor Market Information
The Growth Occupational Tool (GOT) is a powerful resource for analyzing Occupational Employment and Wage Statistics (OEWS) data in Maryland. With GOT, you can explore a wide range of information on occupations, including employment levels, growth trends, wages, employment concentration, and more.
The tool opens by default to a statewide map view, where you can search for specific occupations using the search bar and filter results by employment or salary. To access data for a particular local area, simply click on the region of interest. GOT also allows you to sort columns, making it easier to pinpoint the data you need. Be sure to explore the detailed data tabs to access comprehensive occupational insights for your area.
About the Data
A location quotient measures how concentrated an occupation is in a given area compared to a larger geographic region. For example, you might compare Montgomery County to the state of Maryland, or Maryland to the entire U.S. A location quotient of 1 indicates that employment in the occupation is just as concentrated in your area as in the larger comparison region. A location quotient of 2 indicates that there is twice as much employment in an occupation in your area as we would expect given employment patterns in the larger region.
GOT groups occupations into three categories: Growth, Emerging and Other.
- Growth Occupations have a location quotient greater than one and positive over-the-year growth. These occupations are specialized in your area and are expanding.
- Emerging Occupations have a location quotient less than one and positive over-the-year growth. These occupations are not yet specialized in your area, but they are expanding.
- Other Occupations have negative over-the-year growth.
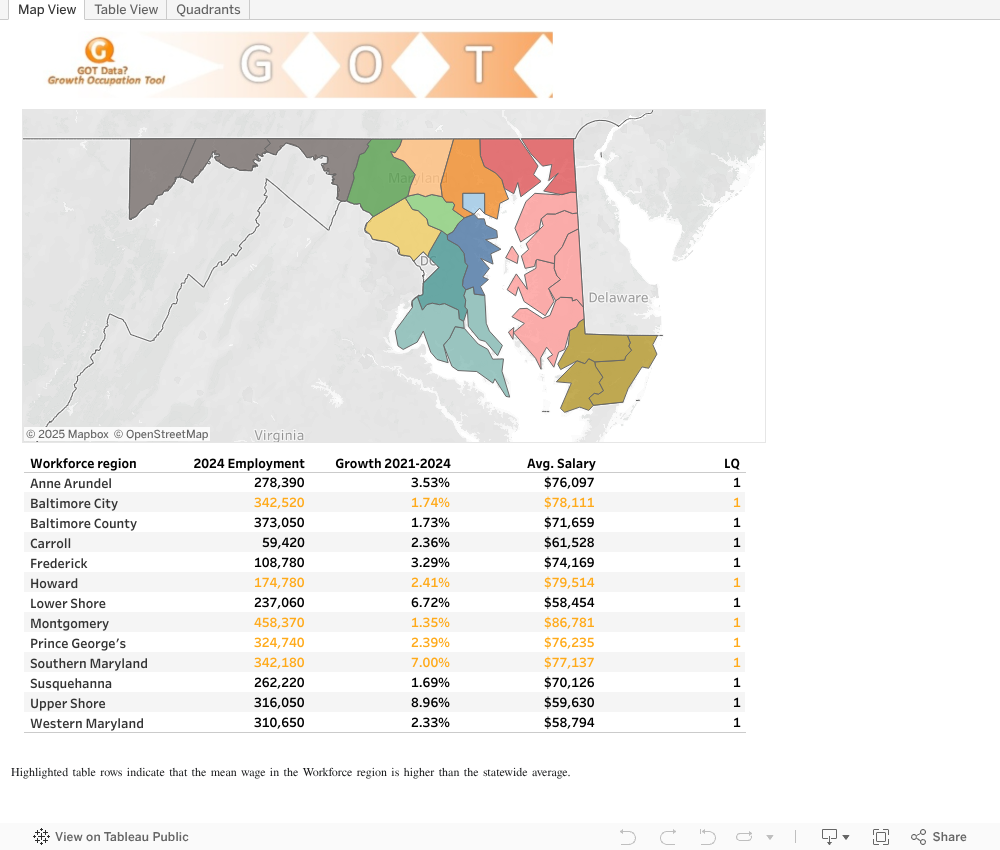
Key:
Workforce Region (Local Areas)
Employment
Growth
LQ: Location Quotient (measures employment concentration)
Salary: Annual Mean Wage
GOT your Local Area Data? Find it here:
Maryland Department of Labor
Division of Workforce Development and Adult Learning
100 S. Charles Street, Tower 1
Baltimore, Maryland 21201
410-767-2250
[email protected]