Foreclosure Data Tracker - Financial Regulation
Last updated July 13, 2026
Please review the “Description of Data” and the drop-down headings (below) to understand the data reported on this page.
Description of Data
Maryland law requires certain parties to submit notices and registrations to the Office of Financial Regulation (OFR) at three stages of the residential foreclosure process. The notices and registrations are submitted to OFR electronically, through the Maryland Foreclosure Registration System (FRS). OFR uses the notice and registration data to assist in carrying out its supervisory and investigative powers, conducting outreach activities, and analyzing foreclosure trends.
Pursuant to Maryland law, some of the notices and registrations are also available to state, county, and municipal government officials to aid in property nuisance abatement (e.g. code enforcement and law enforcement) or other responsibilities under the purview of state or local jurisdictions. The FRS is not available for public use - except with respect to limited property-specific information under certain criteria - and the records contained therein are only accessible to authorized parties.
Contact Foreclosure Administration staff at [email protected] if you have questions about the Foreclosure Registration System. See Residential Property Foreclosures (Information and Procedures) to learn more about OFR’s authority with respect to foreclosure. Tax sale foreclosures are not under the authority of OFR and not included in the FRS data.
For additional foreclosure data, see the quarterly foreclosure reports, available at the bottom of the Maryland Department of Housing and Community Development’s Research webpage.
Notice of Intent to Foreclose (NOI)
A Notice of Intent to Foreclose (NOI) is a written notice that a mortgage servicer is required to mail to a homeowner before the servicer starts the foreclosure process. NOIs are sent after the homeowner has missed one or more mortgage payments or is otherwise in contractual default of the mortgage loan. In some situations, NOIs may also be issued by a secured party for a non-mortgage default, such as past due homeowner’s association or condominium fees, mechanic’s liens, or unpaid water and sewer bills. An NOI notifies the homeowner that they are in default and, unless they act to resolve the default, that a foreclosure action could be filed in court in as little as 45 days. NOIs contain important information about the loan or debt and, if applicable, a loss mitigation application.
Maryland law requires the mortgage servicer or secured party to electronically submit a copy of the NOI data to OFR within 5 business days after mailing the written notice to the homeowner. See Real Property §7-105.1(c) and COMAR 09.03.12.02.
Most homeowners who receive an NOI are not foreclosed upon because they are able to reach a resolution with their mortgage servicer or secured party by paying the amount owed, entering into a repayment plan, selling the property, or by resolving the default through some other manner.
Notice of Foreclosure (NOF)
A Notice of Foreclosure (NOF) is an electronic registration submitted to OFR by the mortgage servicer or other party authorized to foreclose. The NOF must be submitted within 7 days after the legal documents that start the foreclosure process have been filed in court (the “Order to Docket” or “Complaint to Foreclose”). The NOF contains basic information about the property and is used primarily by local governments to aid in property nuisance abatement. See Real Property §7-105.2.
Not every property with an NOF will be foreclosed upon. A foreclosure action may be dismissed by the court if the homeowner is able to reach a resolution with their mortgage servicer or secured party by paying the amount owed, entering into a repayment plan, selling the property, or by resolving the default through some other manner.
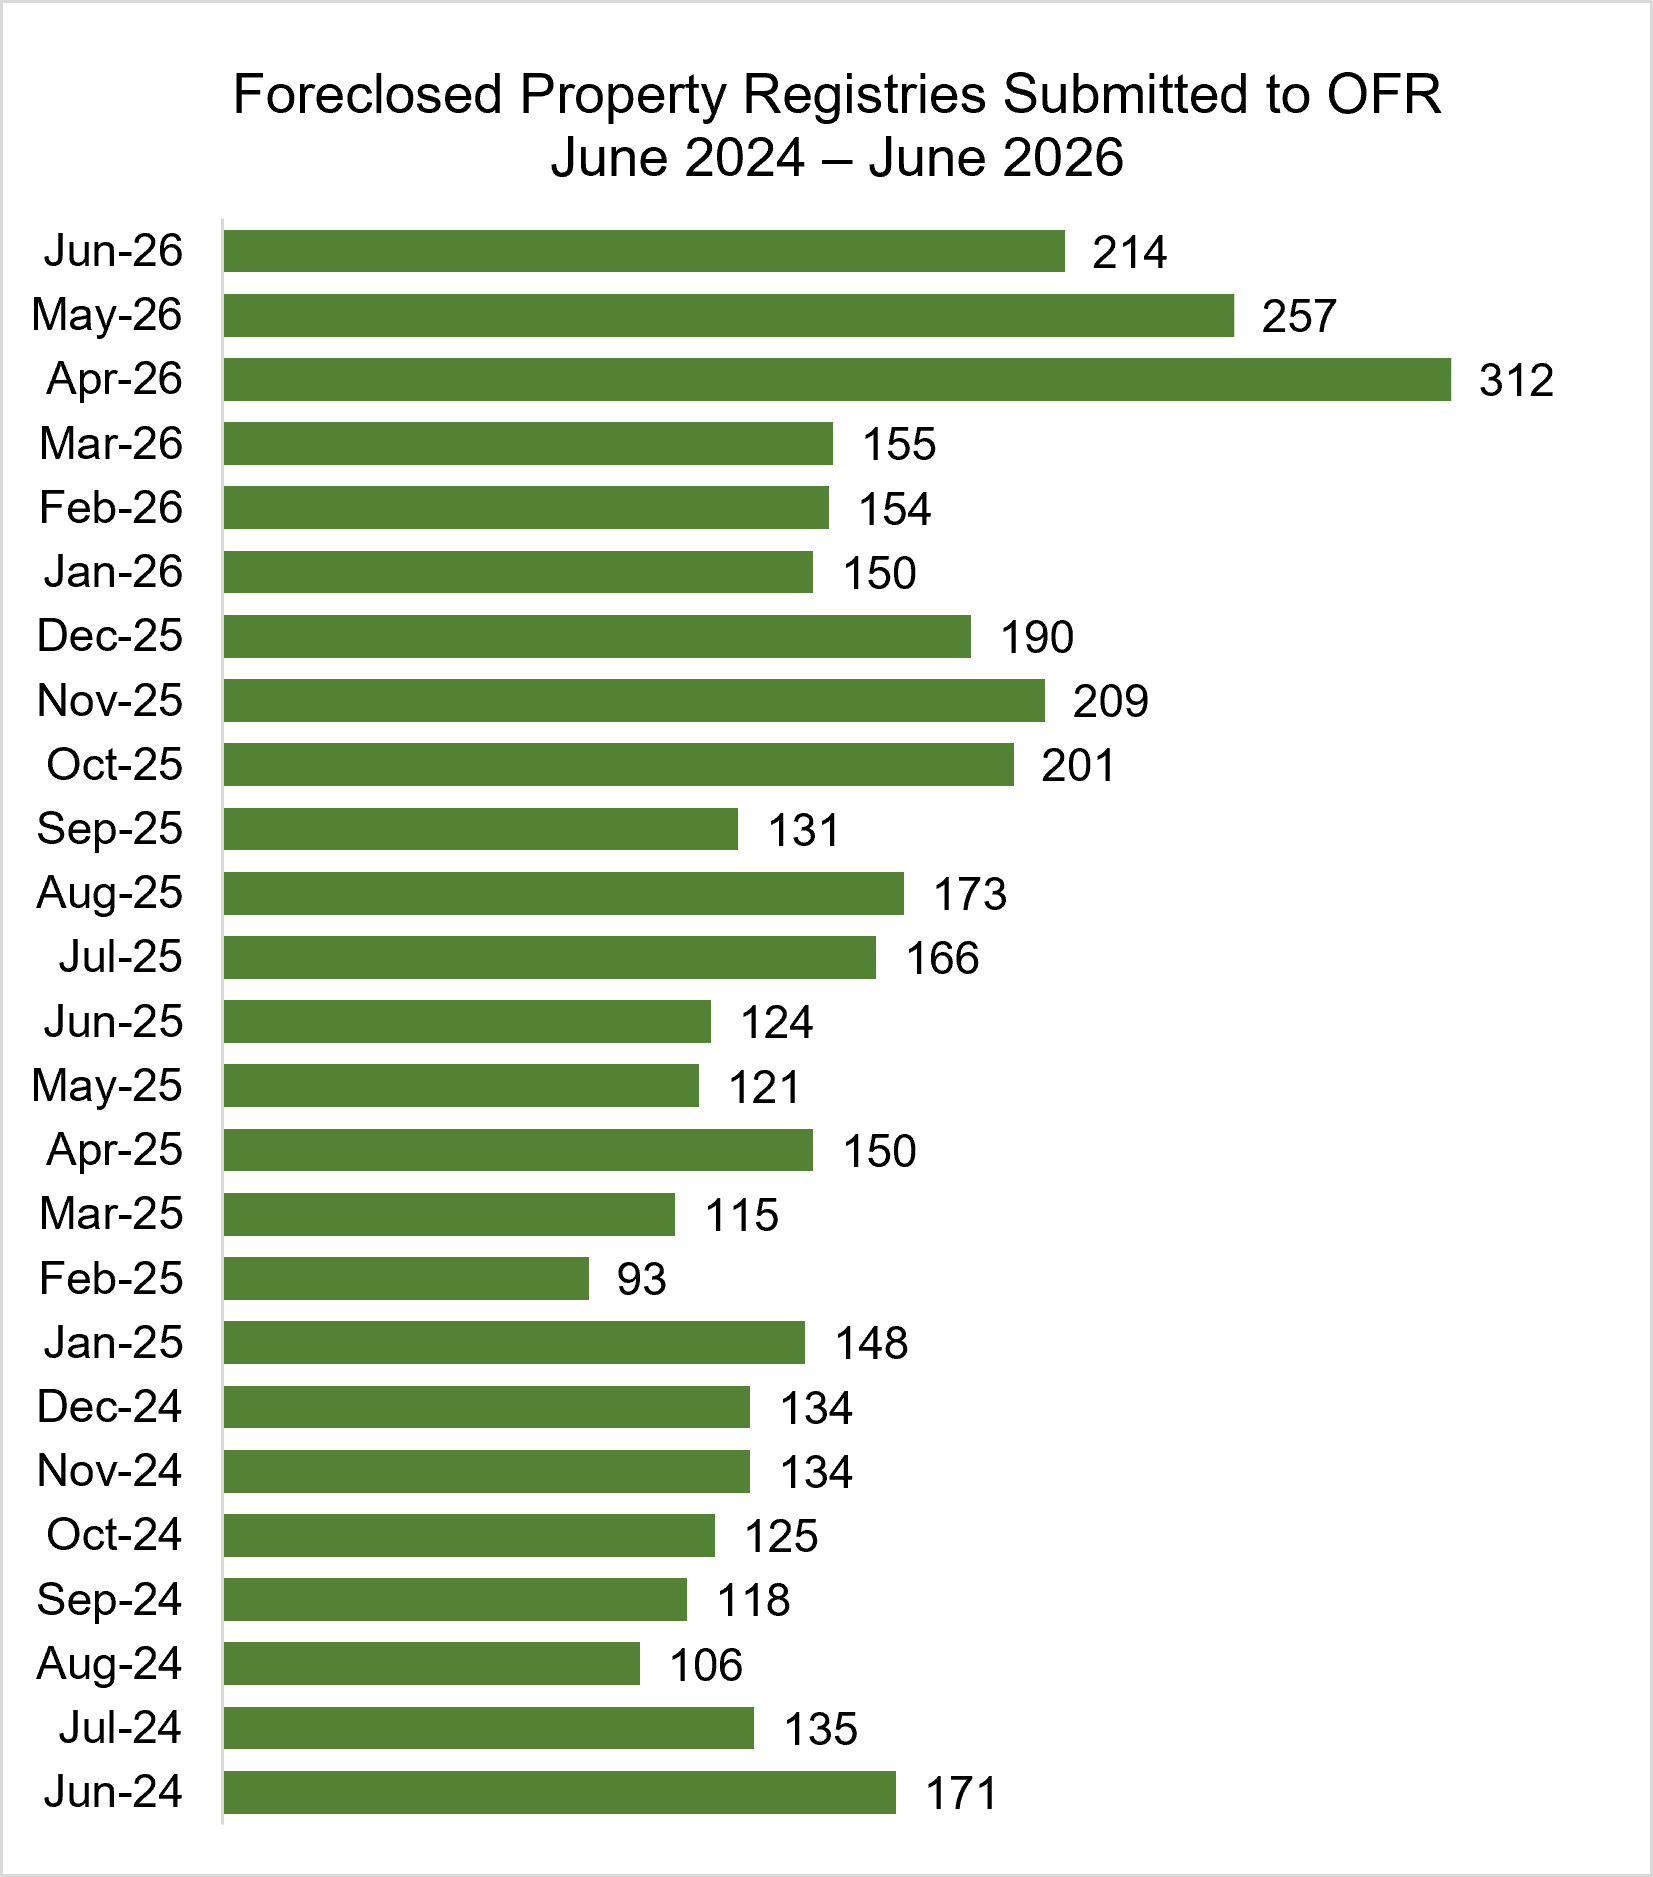
Foreclosed Property Registration (FPR)
A Foreclosed Property Registration (FPR) is an electronic registration submitted to OFR by the person or entity that purchases a residential property at a foreclosure sale. The foreclosure sale purchaser may be the secured party of the unpaid debt or defaulted loan (for example, the lender, bank, or trust) or a private individual or company purchasing the property at an auction. The FPR must be submitted to OCFR by the purchaser within 30 days after the foreclosure sale. The FPR contains basic information about the foreclosed property and is used primarily by local governments to aid in property nuisance abatement. See Real Property §7-105.14.
DISCLAIMER: The data provided on this page is for informational and research purposes only. The data is compiled from third-party filings with the Office of Financial Regulation pursuant to applicable law (see above). These third-party filings may contain duplicates and other errors and the Office of Financial Regulation cannot guarantee the accuracy and quality of the submissions upon which the data is based. The data does not constitute foreclosure case records and may differ from the official foreclosure records as filed in the courts of the State of Maryland. The Office of Financial Regulation makes no express or implied warranties or representations concerning the data provided on this page.
FRS Data and Figures
FRS data is available on the Maryland Open Data Portal as monthly totals by county and zip code:
- Maryland Foreclosure Data by County
- Maryland Notices of Intent to Foreclose by Zip Code
- Maryland Notices of Intent to Foreclose by Census Tract
The following figures display statewide totals of FRS submissions:
- Figure 1. Summary Table - NOI / NOF / FPR Annual Totals (2012 - Current)
- Figure 2. NOI Bar Graph - Monthly Totals (2 Years)
- Figure 3. NOF Bar Graph - Monthly Totals (2 Years)
- Figure 4. FPR Bar Graph - Monthly Totals (2 Years)
NOTE: Pursuant to Governor Hogan’s executive orders and subsequent regulatory guidance issued by the Commissioner of Financial Regulation, the NOI reporting system was closed to new submissions from April 10, 2020 through June 30, 2021.
Figure 1. Summary Table
NOI / NOF / FPR Annual Totals (2012 - 2025)
| Year | NOI Number | NOF Number | FPR Number |
|---|---|---|---|
| 2025 | 91,076 | 9,103 | 1,821 |
| 2024 | 79,577 | 7,775 | 1,772 |
| 2023 | 66,580 | 9,949 | 2,449 |
| 2022 | 55,671 | 8,309 | 1,789 |
| 2021 | 14,028 | 2,002 | 1,061 |
| 2020 | 19,123 | 6,246 | 1,953 |
| 2019 | 69,938 | 17,277 | 6,341 |
| 2018 | 68,634 | 3,973* | 7,706 |
| 2017 | 73,362 | - | 9,895 |
| 2016 | 77,185 | - | 13,235 |
| 2015 | 67,915 | - | 15,894 |
| 2014 | 84,927 | - | 16,767 |
| 2013 | 121,899 | - | 11,276 |
| 2012 | 157,893 | - | 1,149** |
*NOF requirement effective October 1, 2018
**FPR requirement effective October 1, 2012
NOTE: NOI submissions identified as duplicates not included in these totals
Figure 2. NOI Bar Graph - Monthly Totals (2 Years)
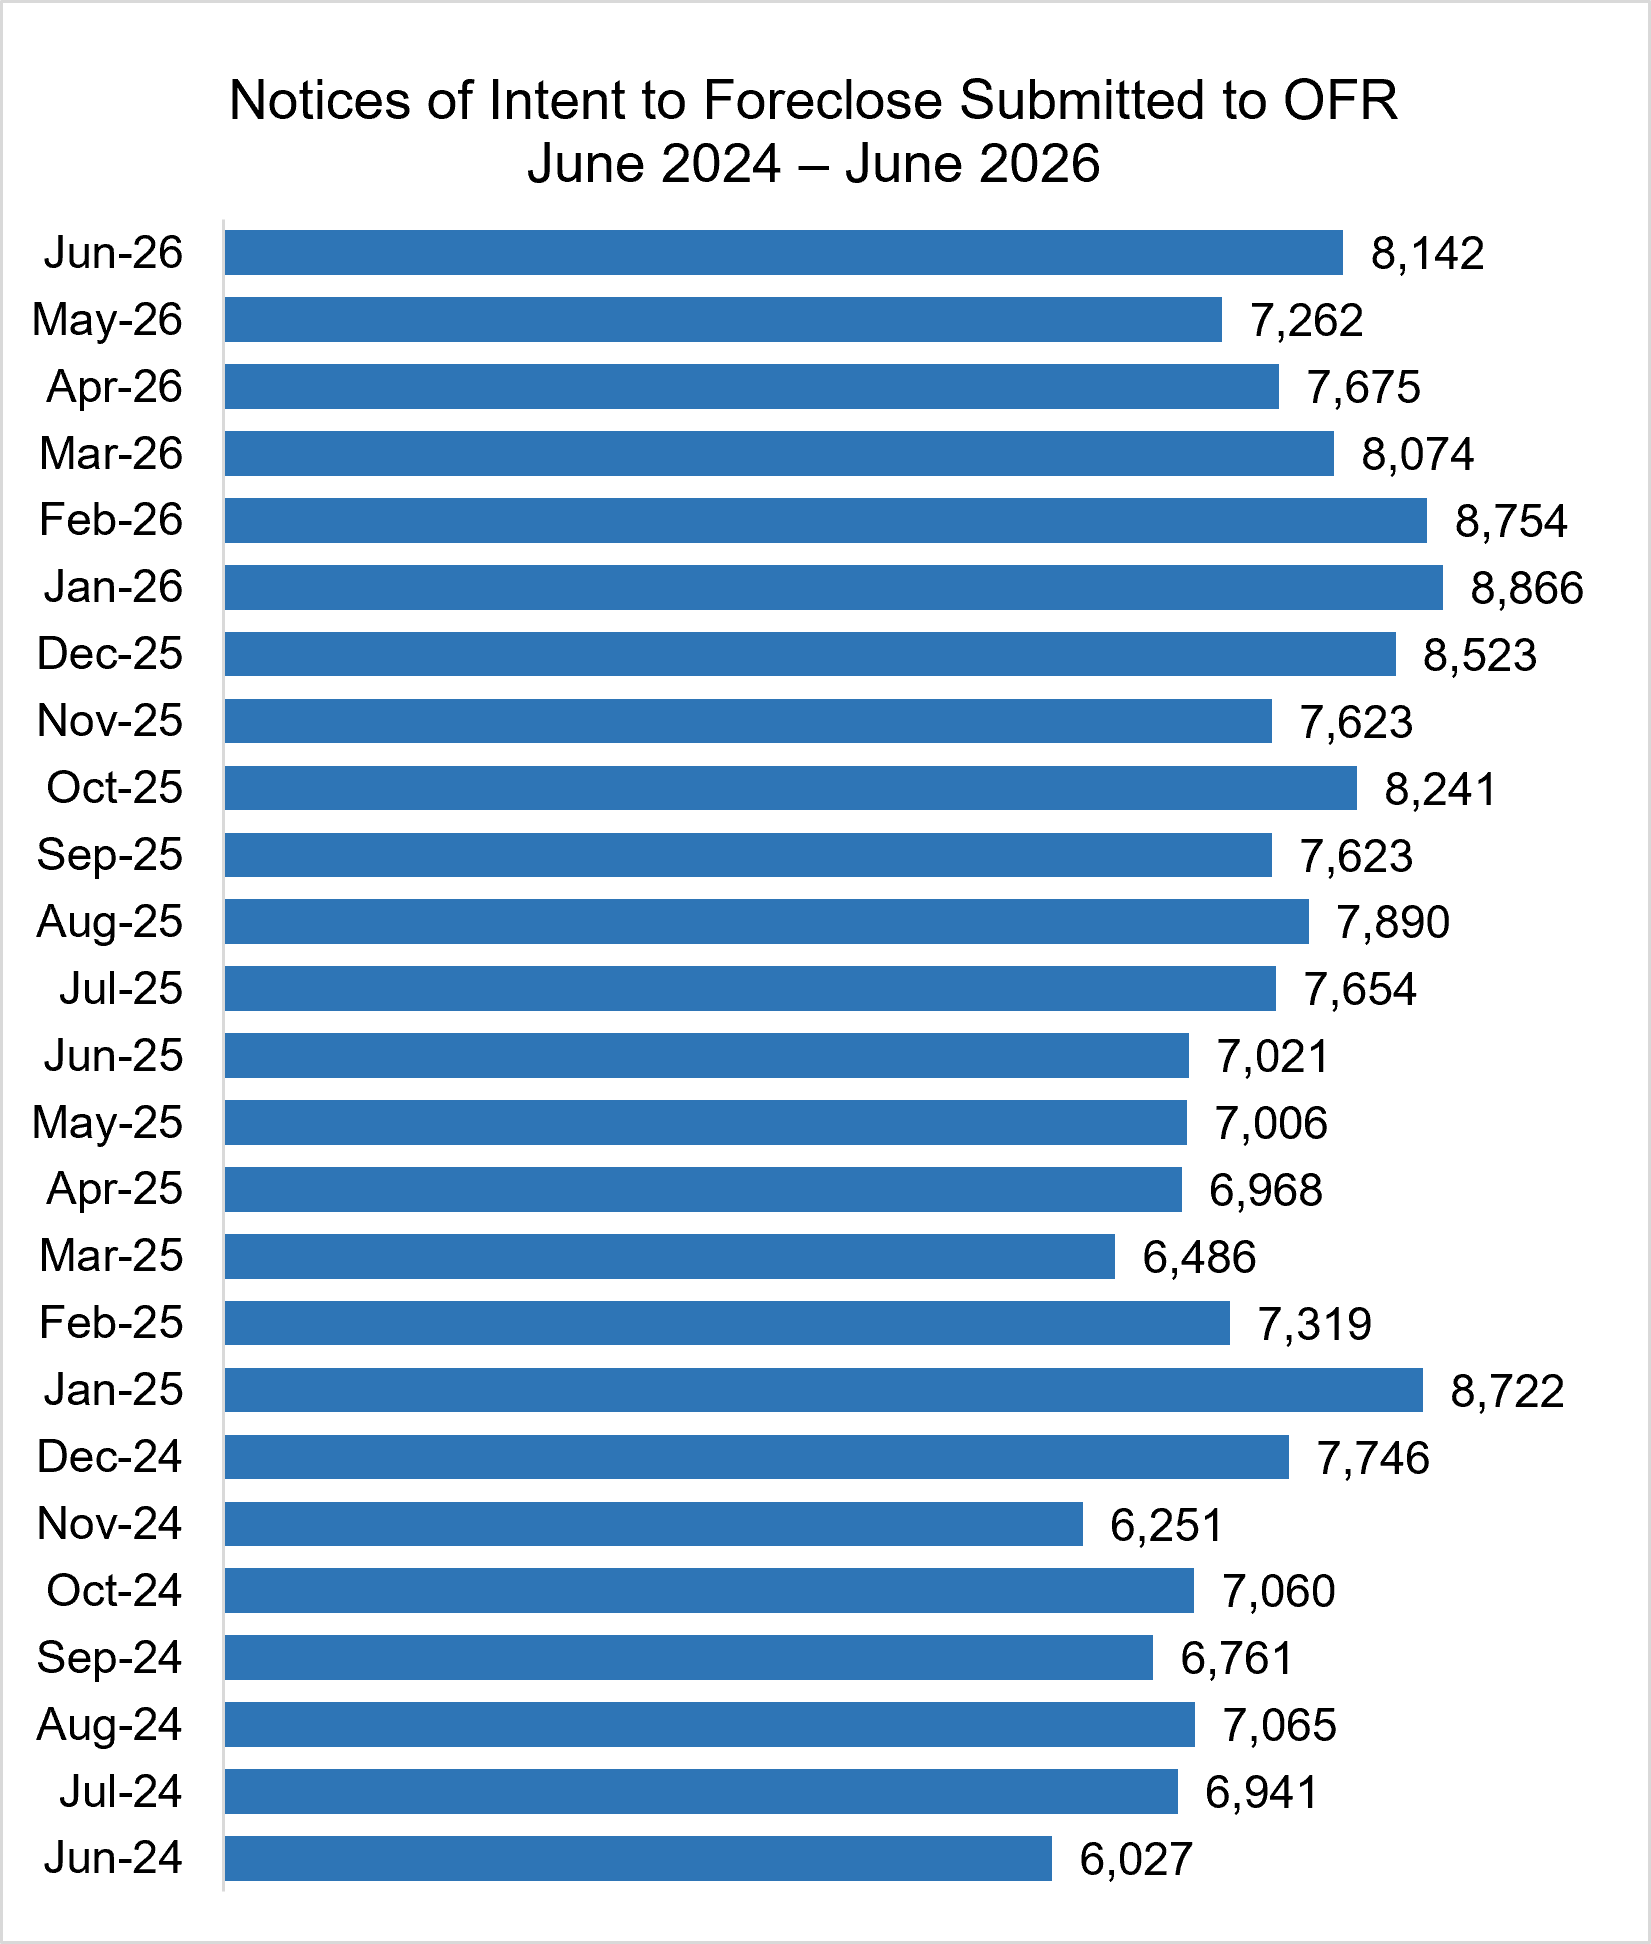
Figure 3. NOF Bar Graph - Monthly Totals (2 Years)
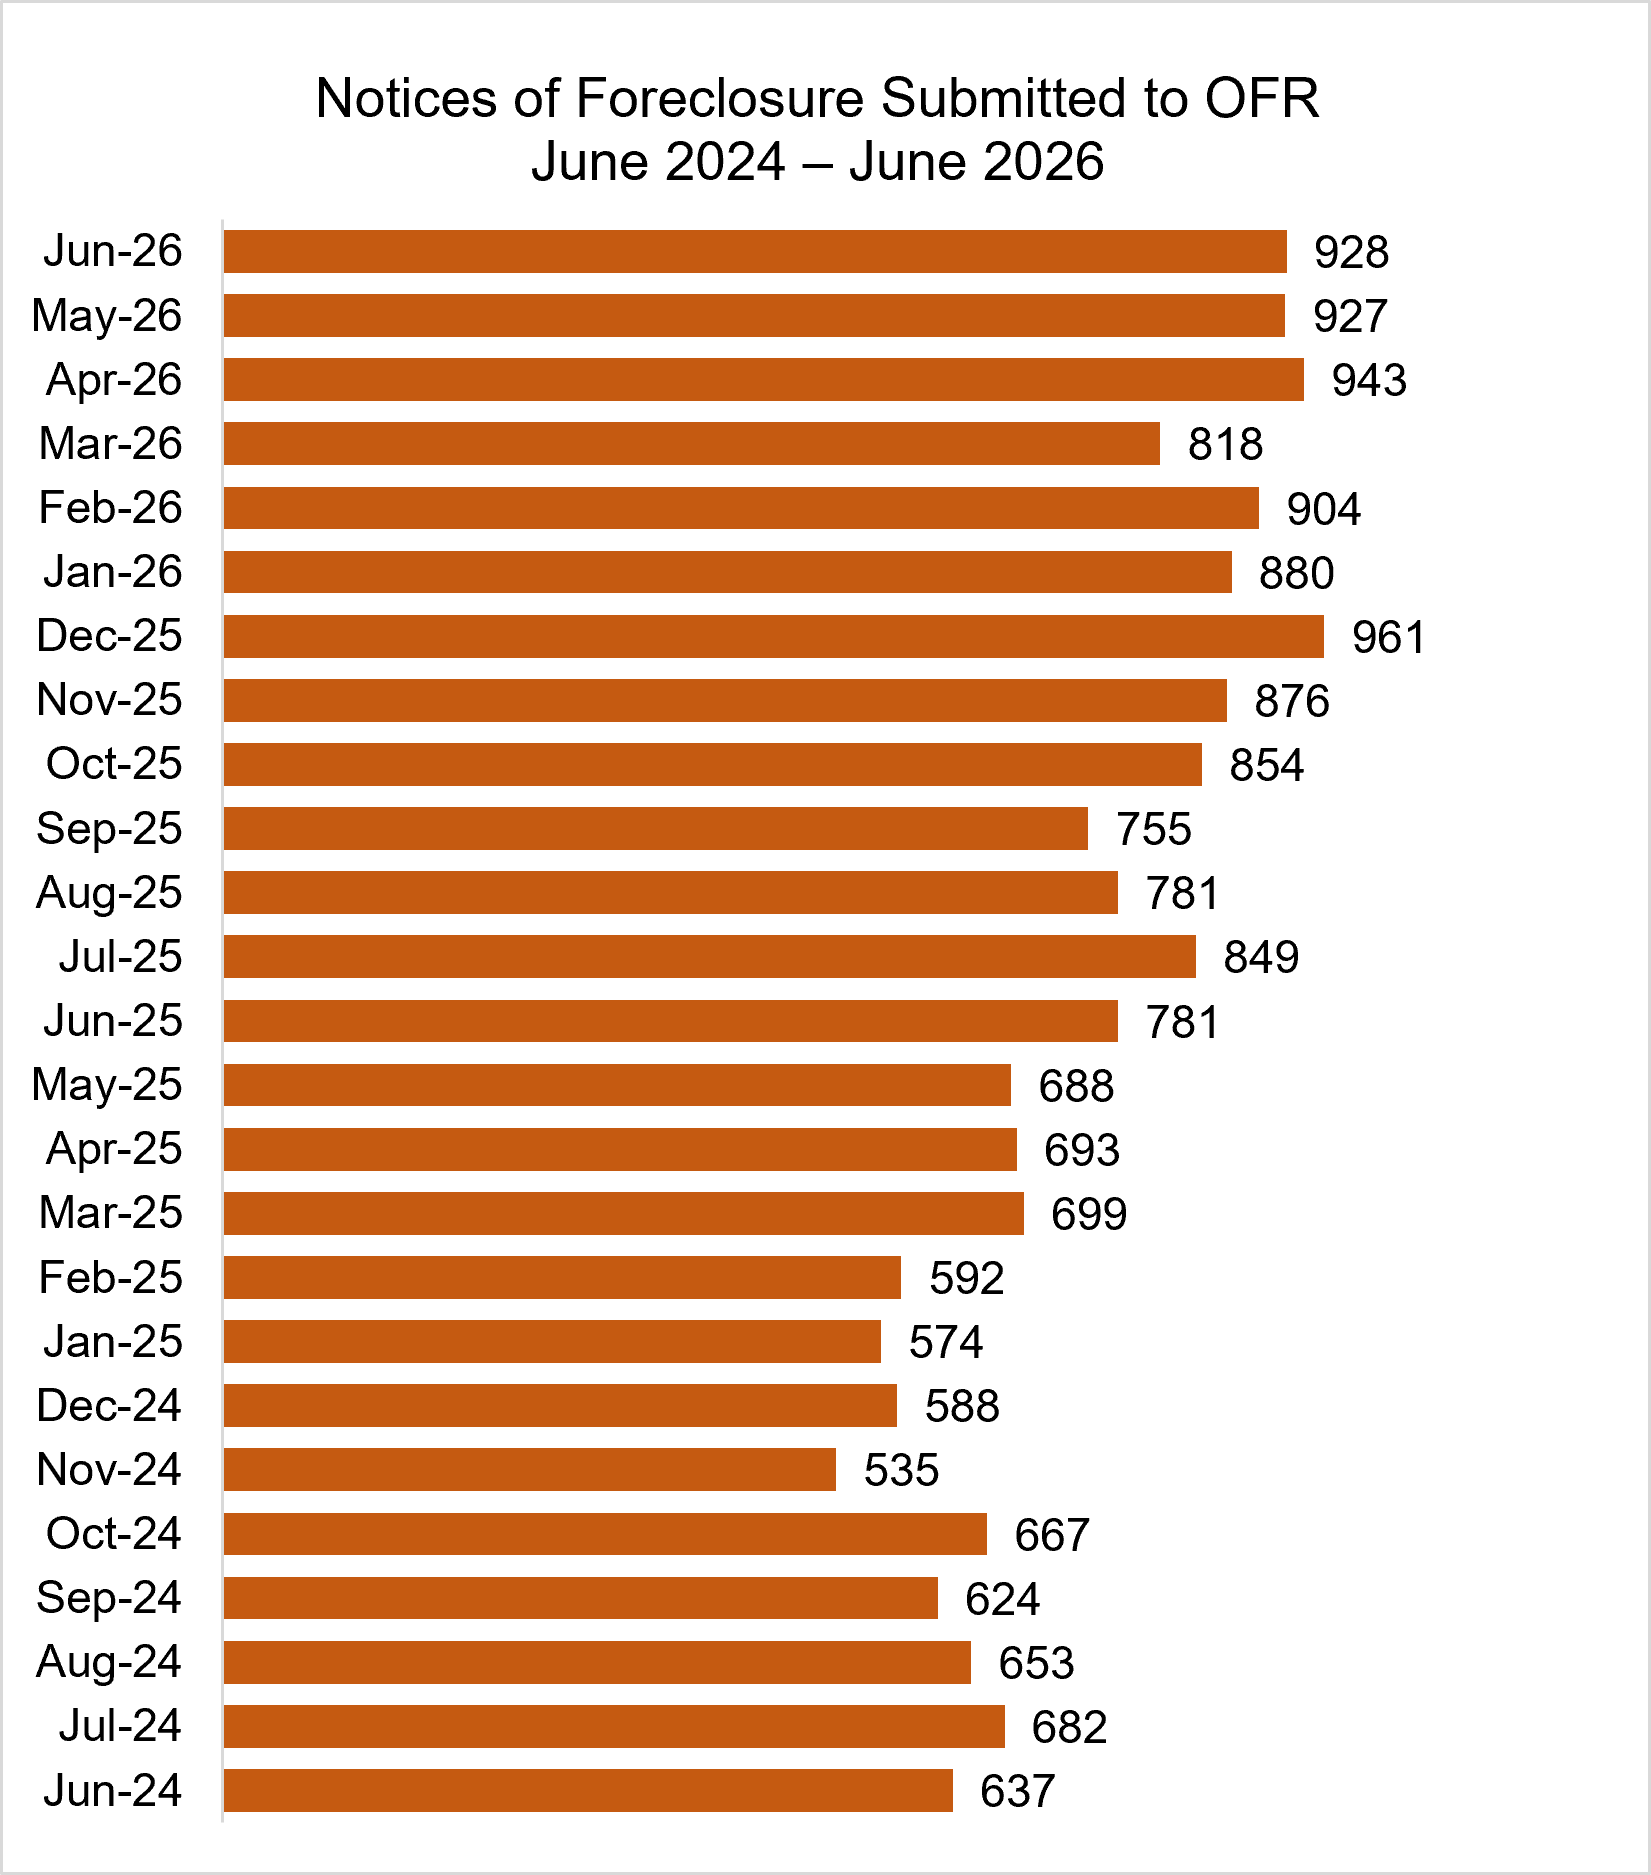
Figure 4. FPR Bar Graph - Monthly Totals (2 Years)